Accessibility settings

Settings are saved in this browser and apply on every page of the site.

Text size 100%

Accessibility is built into the site code. This menu is an extra, not a substitute.

ST-00Projects

From the field, through the layer, into everyday work.

Surveys, systems and software we have built for local authorities, regional councils and public bodies in Israel. Each project shows what needed solving, what we did and what the client can do now. Client names appear only where we have permission to publish them.

CRS
EPSG:2039 · ITM
Origin
E 180,315 · N 628,192

ST-01 From the field

Work you can see on the map

Each card opens the full story: the challenge, the solution, what was delivered and what the client does with it today. The data strip on each card shows the source, the date and the coordinate system where they are known.

16 projects

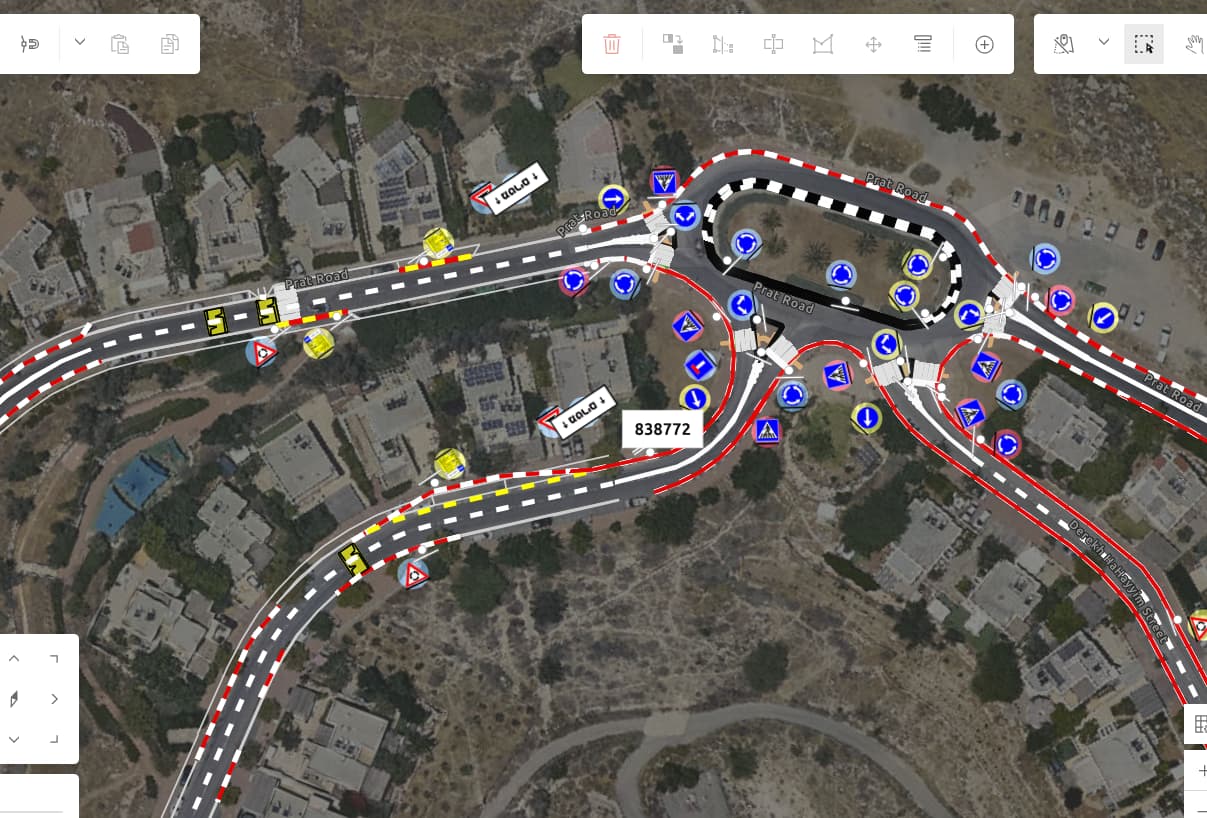
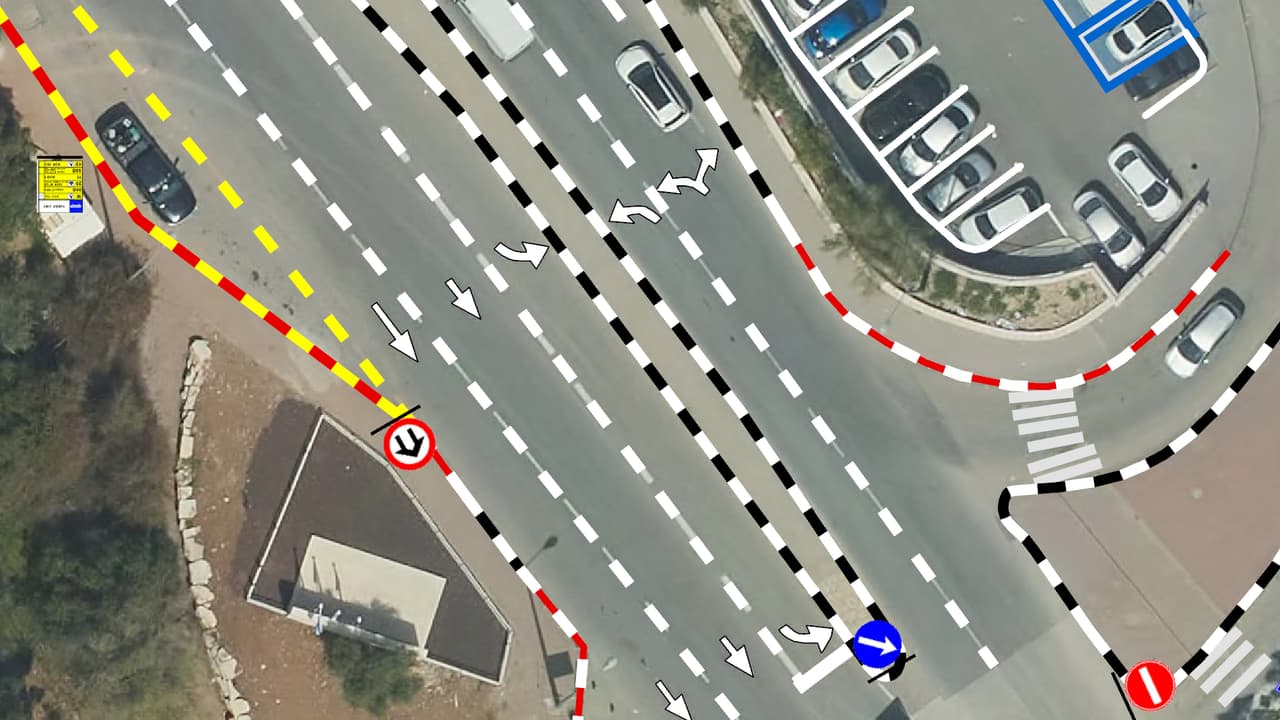
  • Vector road markings, lane arrows and sign symbols over a multi-lane road

    Surveys A local authority

    Vehicle survey of traffic signs and road markings

    Camera vehicles with on-board AI, a person checking every frame, and every sign placed on the aerial photo: GIS layers of signs, poles and road markings, plus a transport app in ArcGIS Online.
    Source
    180°/360° vehicle imagery · aerial photo
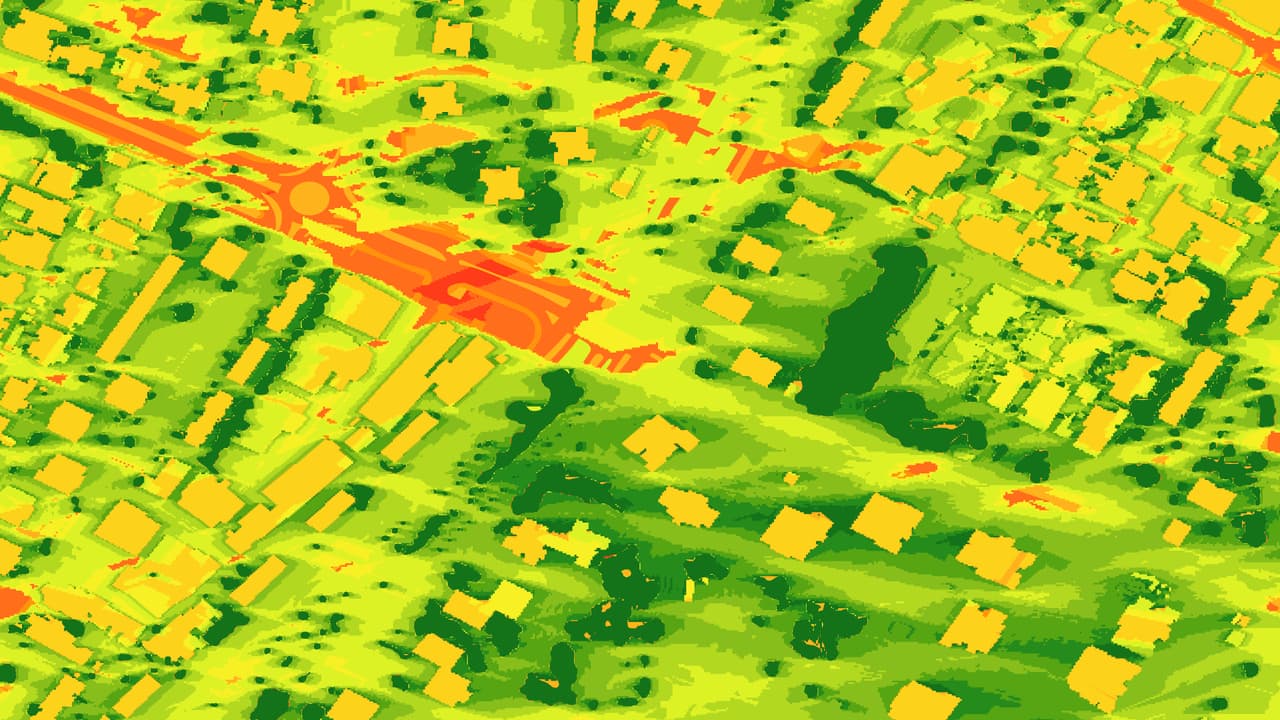
  • Urban heat raster from green to red over buildings, asphalt and vegetation

    Surveys Kiryat Yam Municipality

    Street-level urban heat-island map – Kiryat Yam

    Heat factors coded from the aerial photo, shade computed every half hour, and all of it combined into one shading priority map at the level of streets, paths and bus stops.

    Source
    Aerial photo · height data
    Date
    2024-06
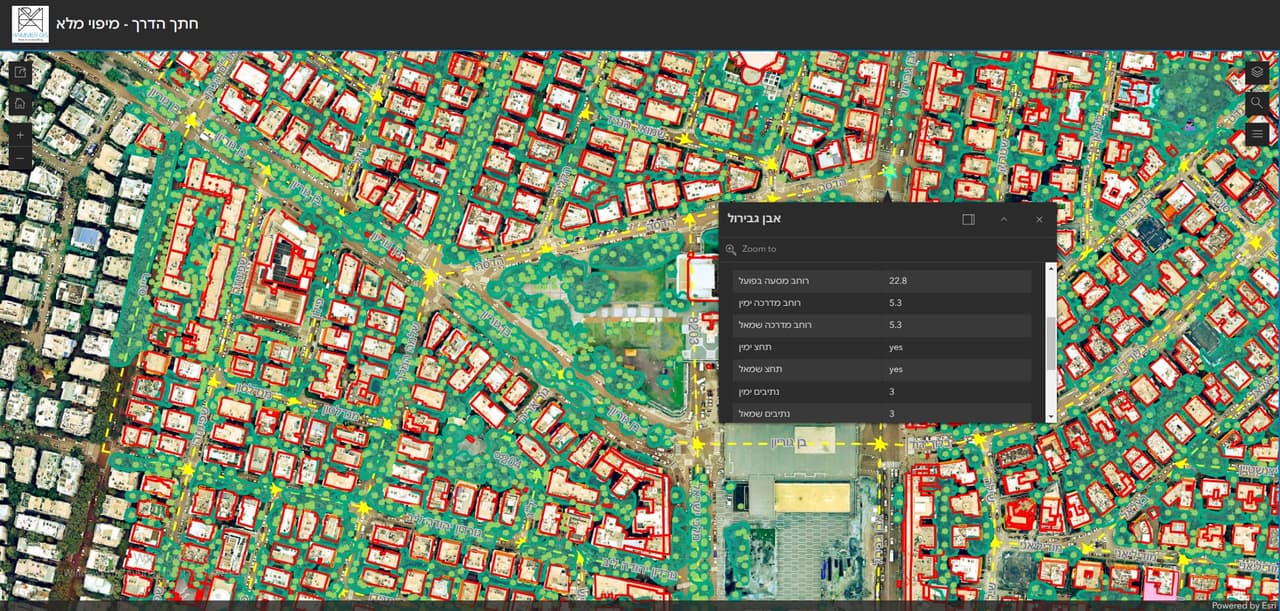
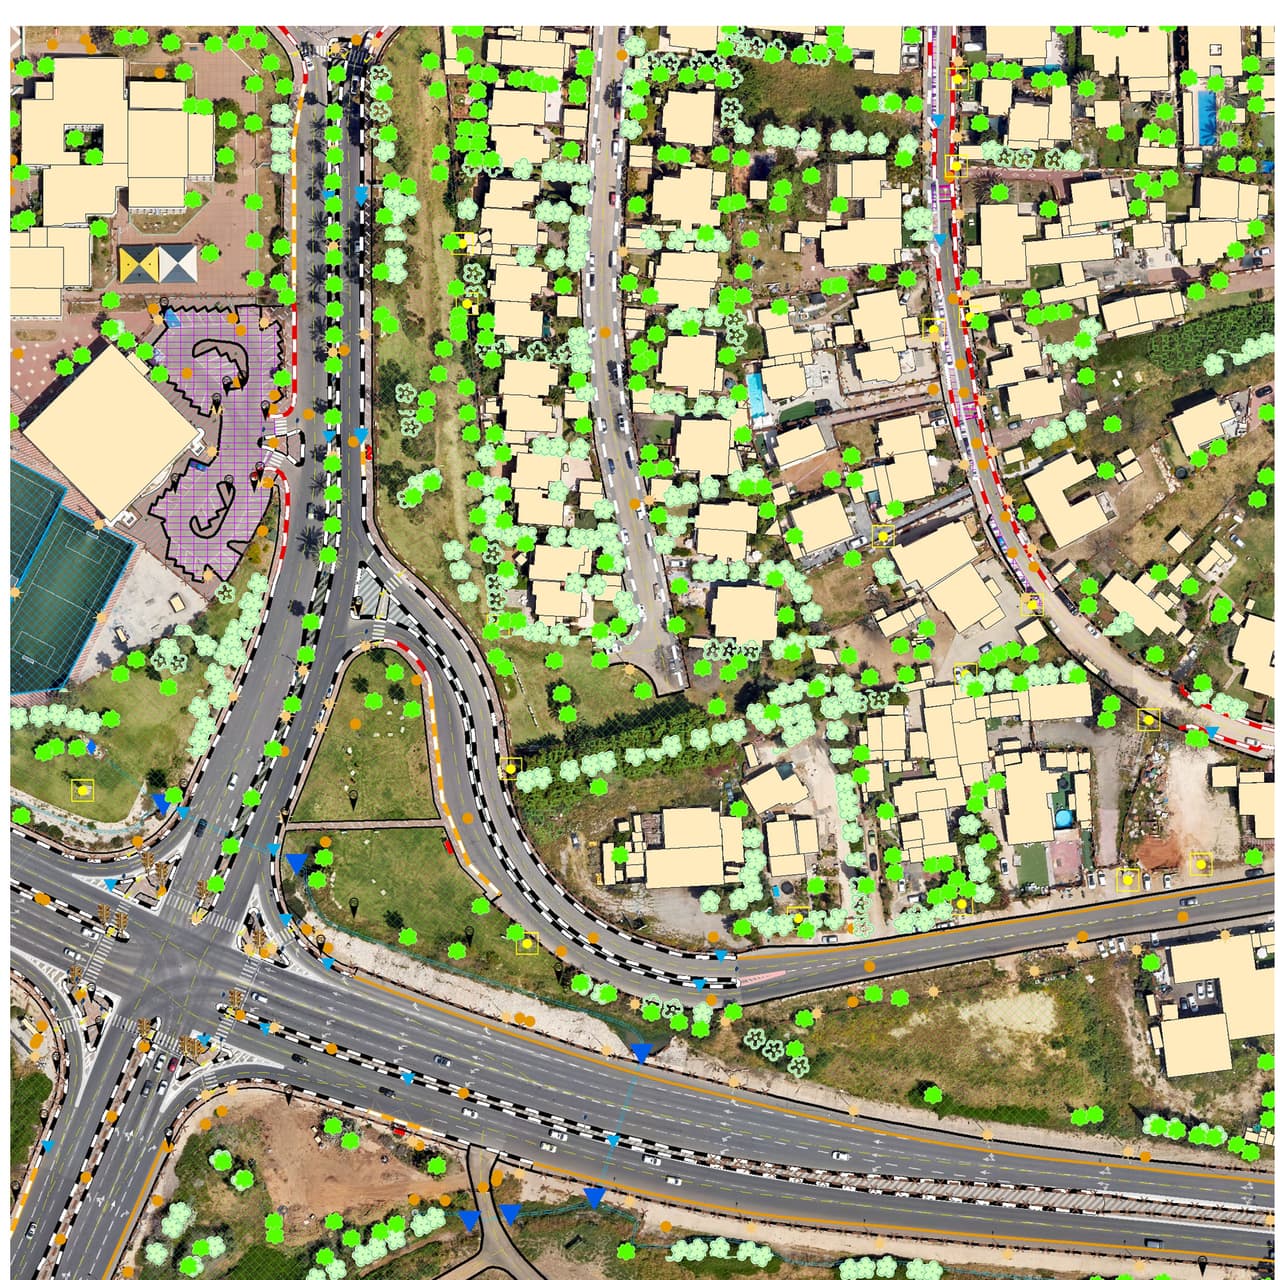
  • The same neighbourhood with digitised GIS layers: buildings, trees and road markings

    Surveys Local authorities

    Ortho-graphy: city base layers from an aerial photo

    Machine recognition on the authority's own aerial photo, manual completion and full QC: buildings, pavements, drainage, poles, signs, trees and more, with heights, in GIS, DWG and PDF.

    Source
    Client aerial photo · 3D model
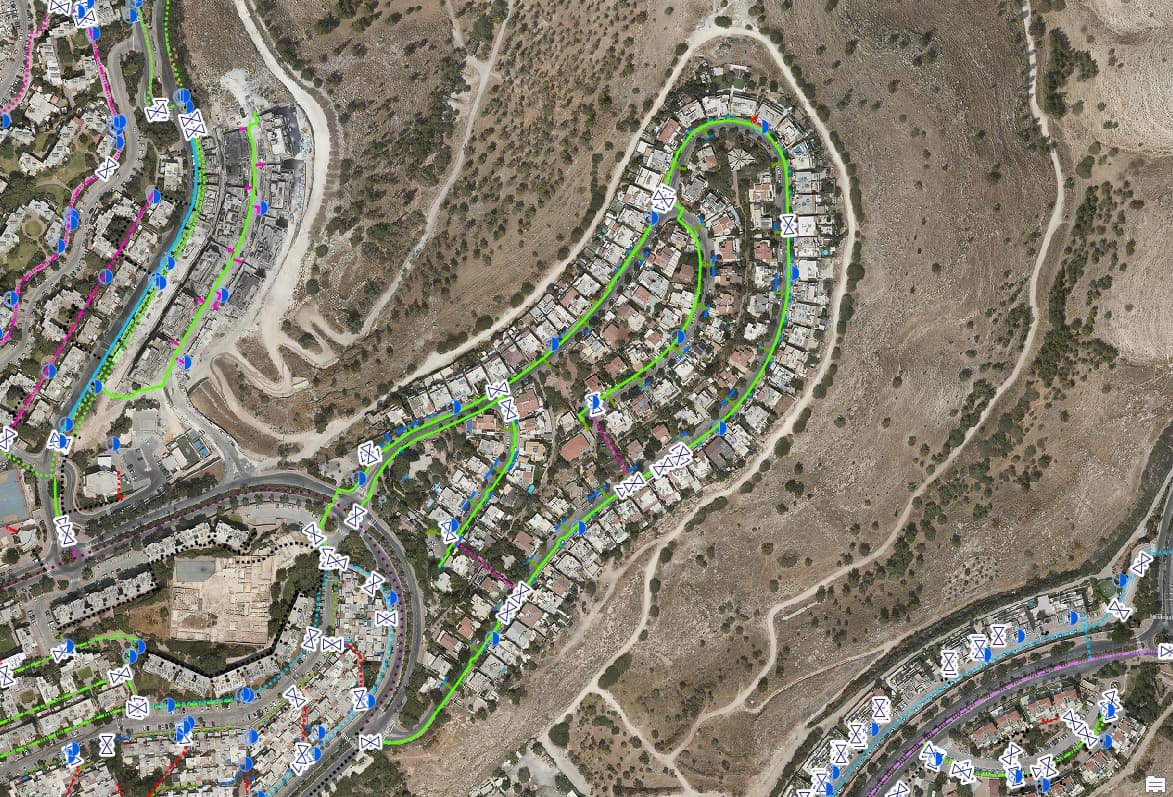
  • Hillside neighbourhood with mapped drainage lines in green

    Surveys Two local authorities

    Drainage surveys: inlets, manholes and lines on the map

    Urban drainage infrastructure mapped on the aerial photo for two authorities: inlets, manholes, drainage lines and inlet lines, with a city-wide survey map and a dashboard.

    Source
    Aerial photo
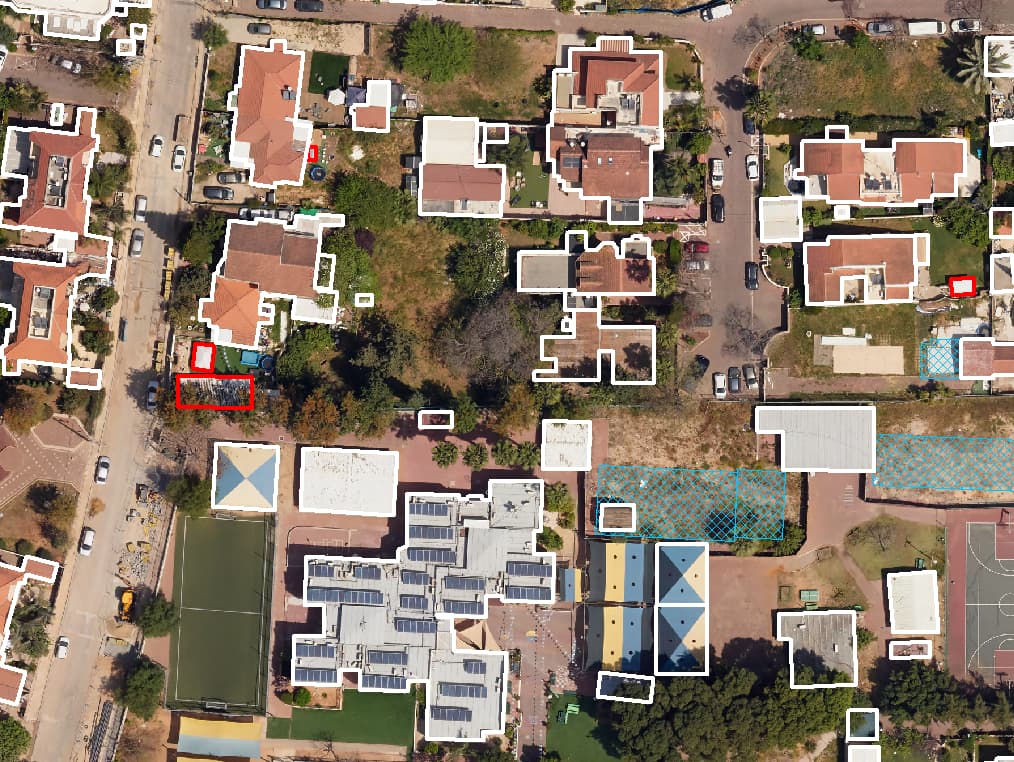
  • Later photo: new building footprints marked in red

    Surveys A local authority

    Building-change survey from two aerial photos

    Every building coded on an older and a recent aerial photo; new, demolished and enlarged buildings flagged in a prioritised findings report for building inspection.

    Source
    Aerial photos 2020/2022 vs 2023 · oblique imagery
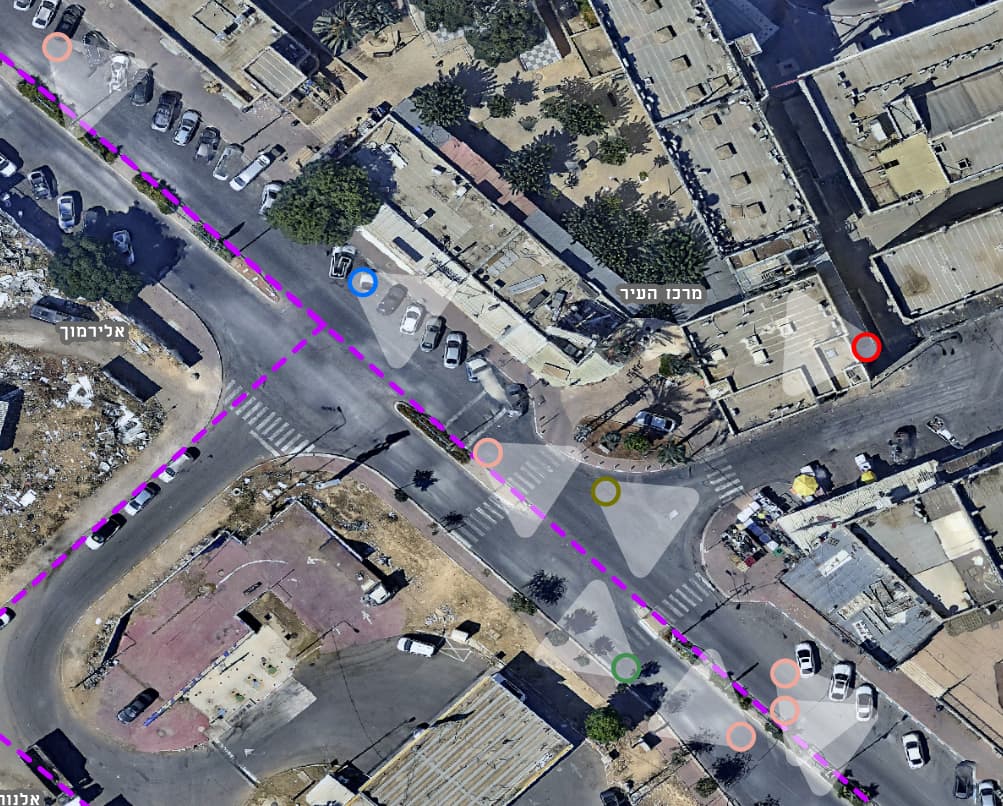
  • Street junction with hazard points and marked lines

    Surveys A local authority

    Public-space hazard survey from vehicle imagery

    Vehicle imagery and AI detection located hazards on pavements and in public space, each placed as a point in a GIS layer.

    Source
    Vehicle imagery · AI detection
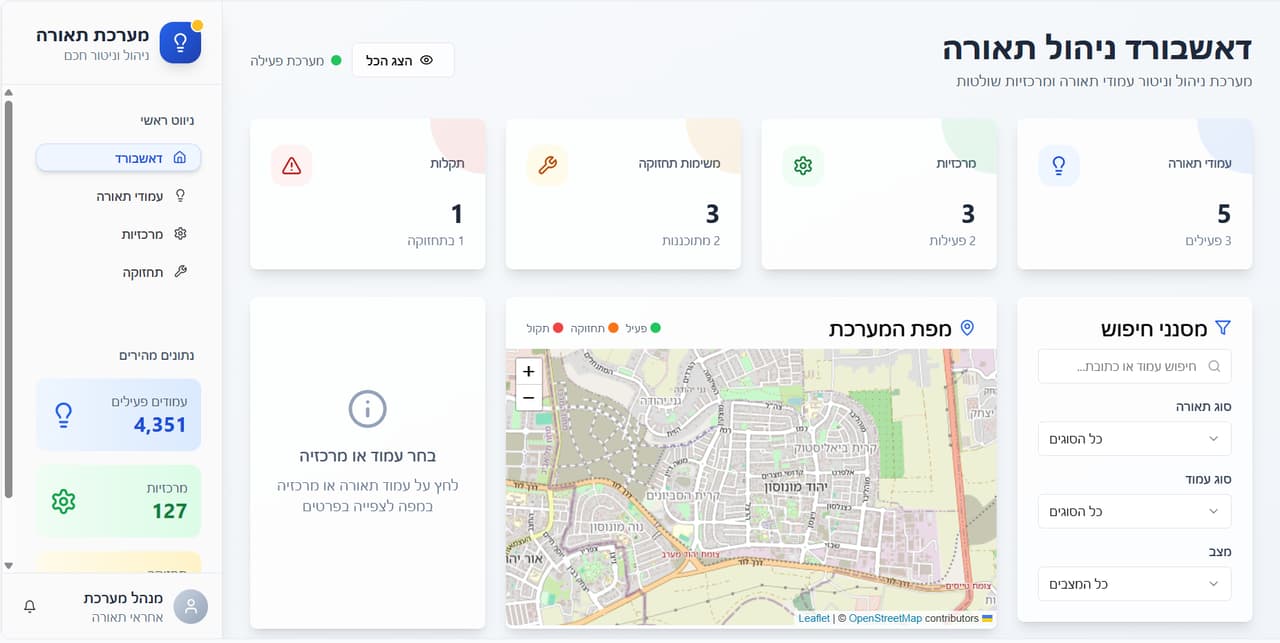
  • Street-lighting dashboard with counters and a pole map

    Surveys A local authority

    Street-lighting survey and a lighting-management dashboard

    Every lighting pole numbered, photographed and recorded by app straight into GIS, linked to its control box, with a lighting-management dashboard.

    Source
    Field survey by mobile app
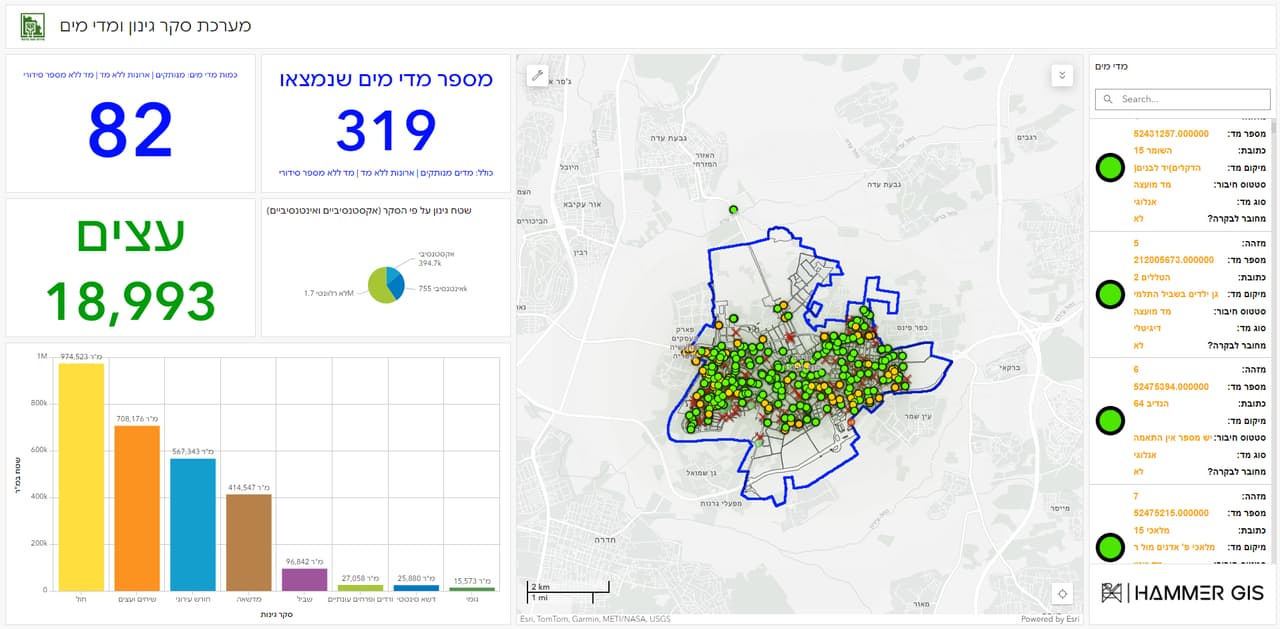
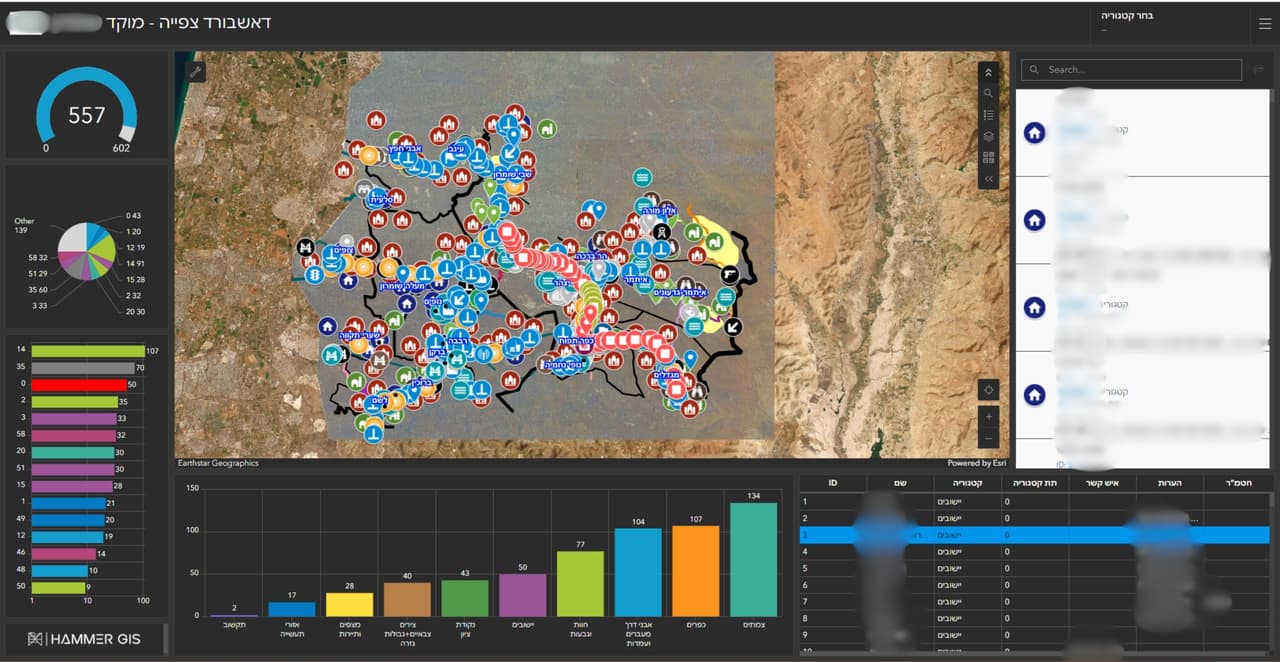
  • Gardening survey dashboard: tree counters, chart and map

    Surveys A local council

    Gardening and water-meter survey with a navigation dashboard

    Trees and irrigation water meters in GIS layers, with a dashboard of counters, charts and a map that navigates to any item from a desktop or a phone.

    Source
    Field survey
  • SIGNYX: planning signs along a road over the orthophoto

    Software A regional council

    SIGNYX: a traffic committee that works on the map

    A system for a regional council's traffic committee: incoming requests, map-based sign planning, committee meetings, decisions and PDF documents, on the council's ArcGIS Online.

    SIGNYX

    Source
    Council ArcGIS Online
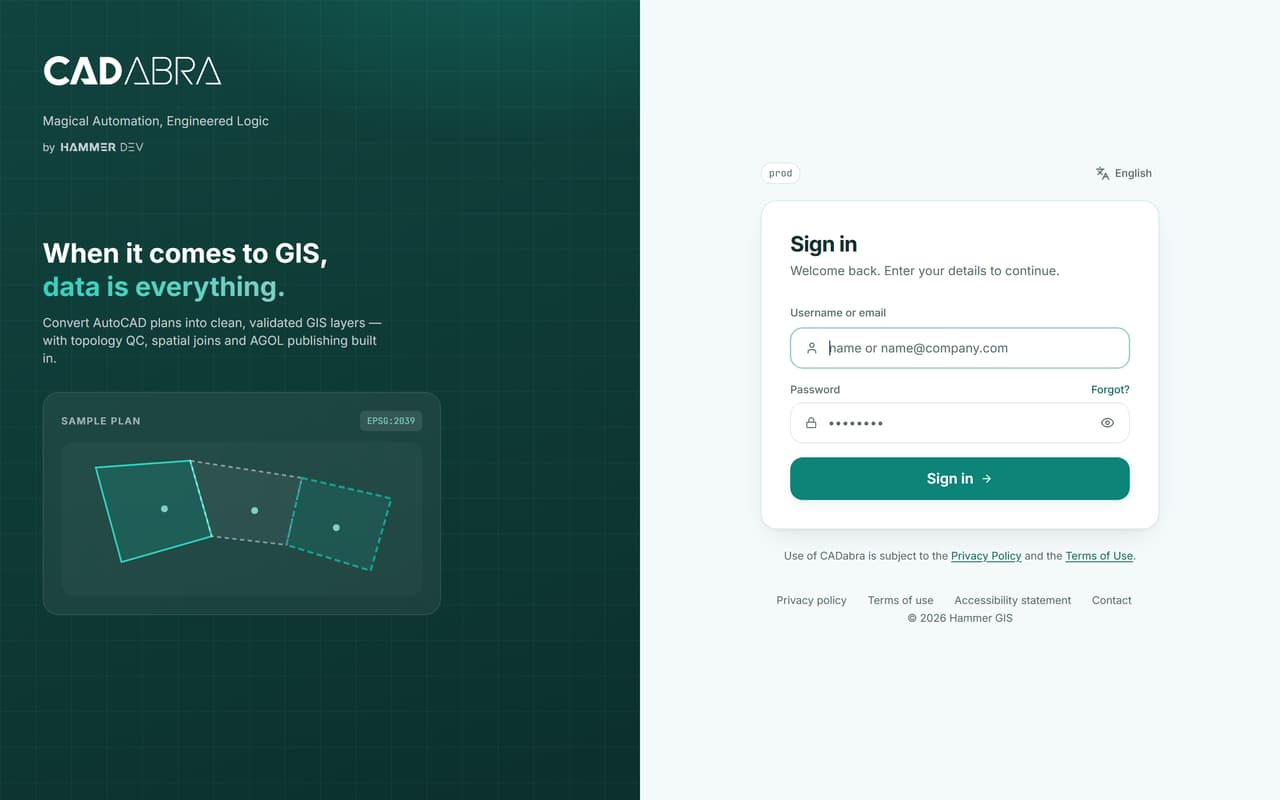
  • CADabra sign-in screen

    Software A municipality

    HAMMER CITY and CADabra: one map for every city department

    One map site for every city employee, in Hebrew and in the city's branding, on its own ArcGIS Online, alongside CADabra for turning AutoCAD plans into GIS layers.

    HAMMER CITYCADabra

    Source
    City ArcGIS Online
    Date
    2026-10
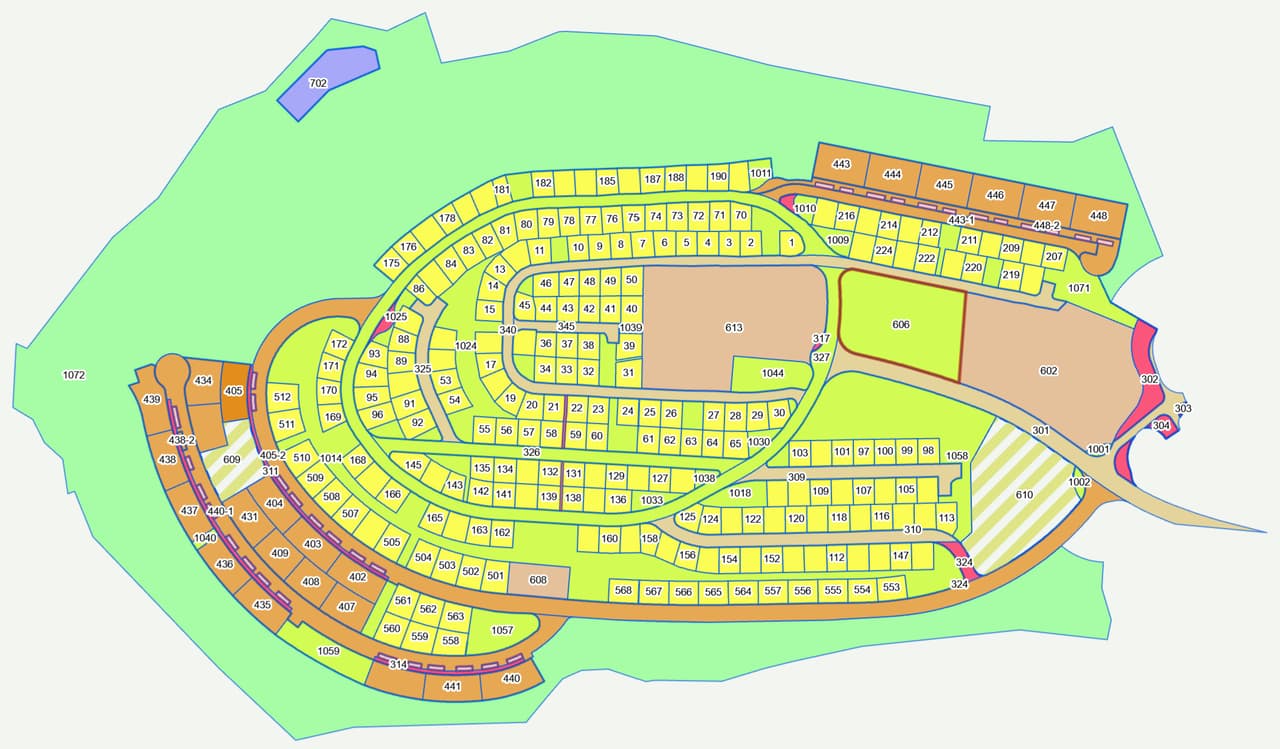
  • CADabra: a full plan converted into coloured land-use layers

    Software Product demonstration on a real survey file

    CADabra: a real AS-MADE survey becomes GIS layers

    A real survey file converted into GIS layers to the Survey of Israel specification: 99.5% of the data entities identified, grade A, with the coordinate system detected automatically.

    CADabra

    Source
    Survey DWG · plan 128/1
    CRS
    EPSG:2039
    Date
    2026-10
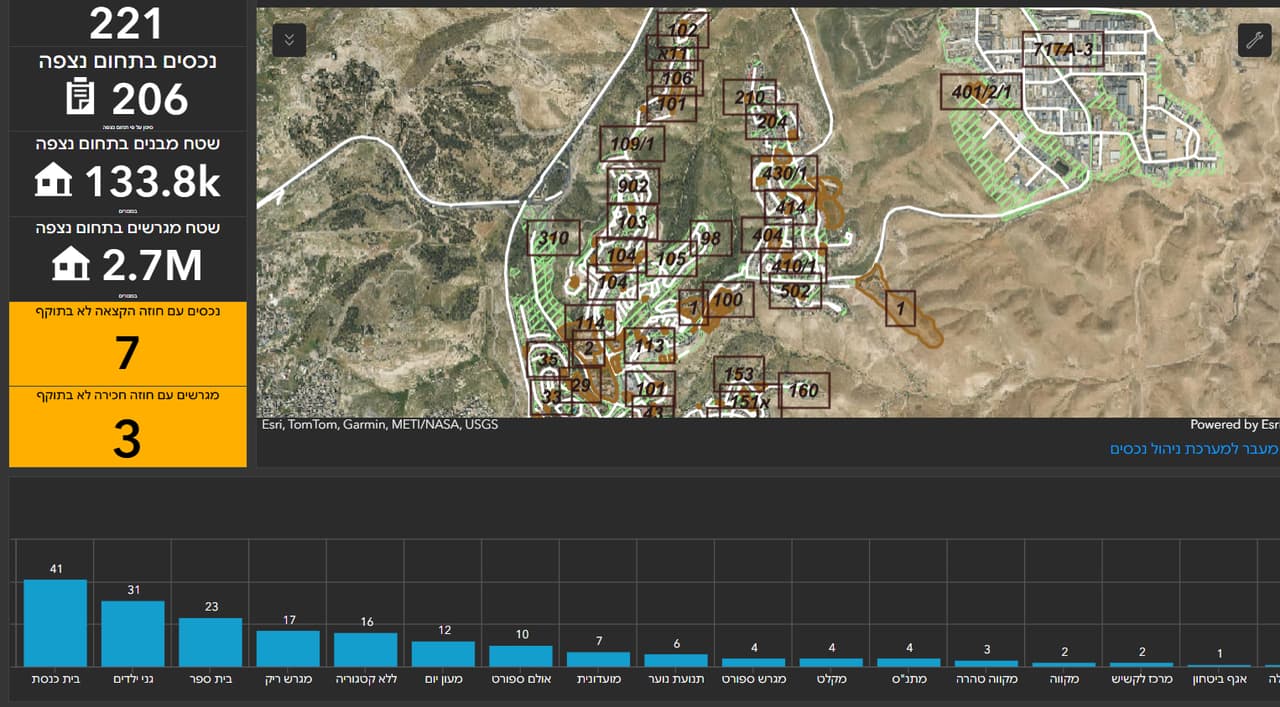
  • Dark assets dashboard with totals and a map

    Service & support A local authority

    A municipal asset-management app

    All of the authority's property on one map: assets, plots, lease contracts and allocations, with an editing map, an editing table, a survey form and an assets dashboard.

    Source
    Authority ArcGIS
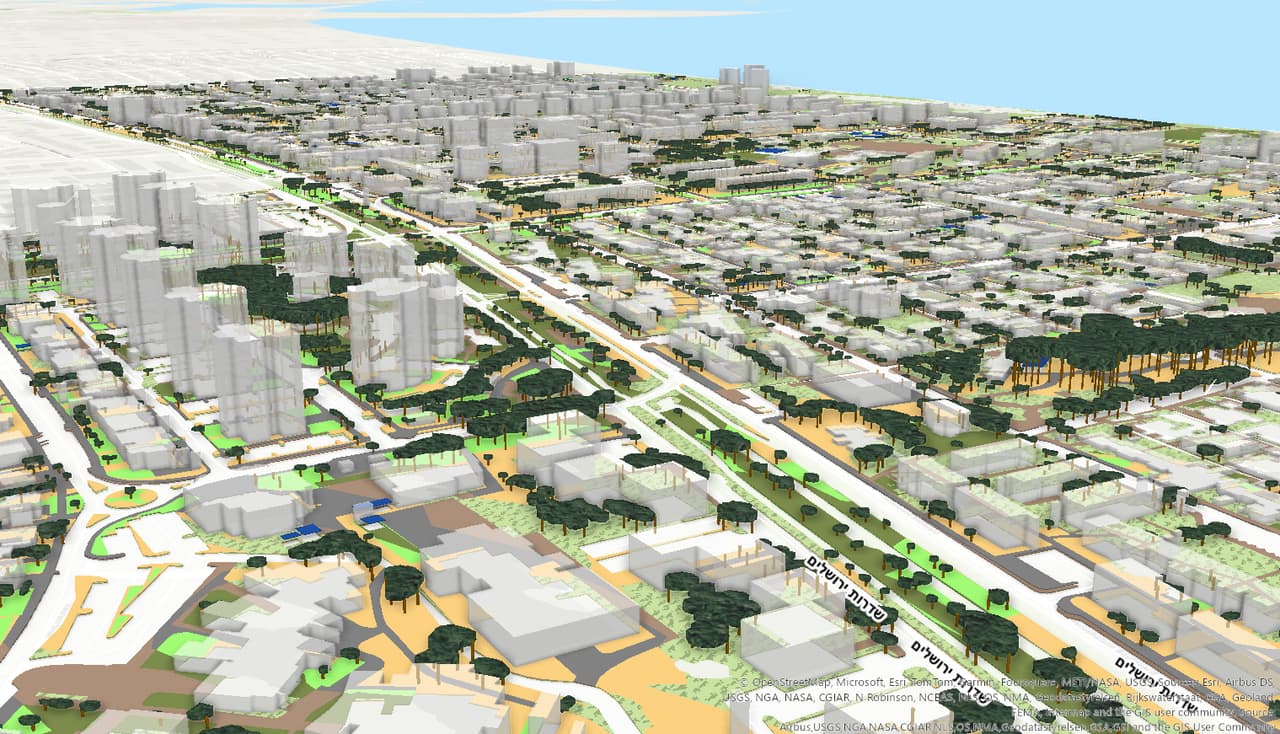
  • Oblique 3D city scene with coastline and towers

    Additional services A city in northern Israel

    A public GIS and a 3D city scene

    A public GIS for browsing the city's layers, and a 3D scene of the city from the coastline to its towers.

    Source
    ArcGIS · 3D city model
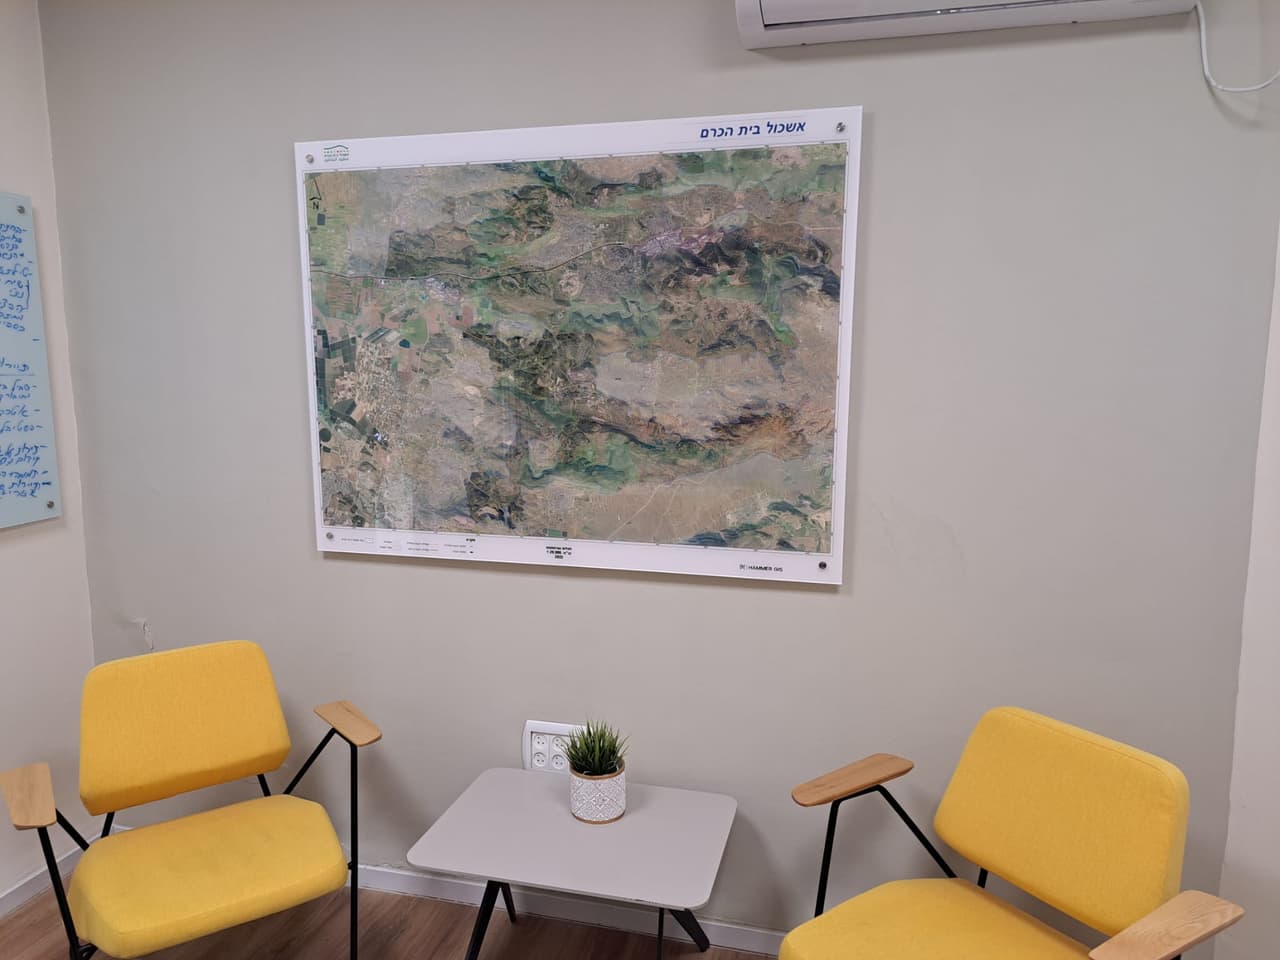
  • Framed aerial wall map in a waiting area

    Additional services Councils and a regional cluster

    Aerial wall maps for council offices

    Wall-sized aerial photo maps with boundaries and base layers for meeting rooms, offices and waiting areas.

    Source
    Aerial photo · base layers

ST-02 How we show our work

Evidence, not slogans

What you see here is real project output: a layer, a map, a dashboard or a report.

Most of our clients are local authorities and public bodies, so we name them only with written approval. Until then, a project is described by client type, such as "a local authority" or "a regional council", and identifying details are removed from the images. Illustrative material is labelled as such and never presented as project output. Numbers appear only when they were measured and checked, as in the CADabra quality report.

  • Source and date

    Every project carries a data strip with the source, the date and the coordinate system where they are known.

  • Names with approval only

    An authority or organisation is named only after written approval to publish.

  • Illustrations labelled

    Illustrative material is marked "concept visualization, illustrative data" and never shown as project output.

ST-03 FAQ

Questions and answers

Why are client names missing from some projects?

Most of our clients are local authorities and public bodies. We name a client only after written approval; until then we describe the project by client type and remove identifying details from the images.

Can I see a demo of one of the systems?

Yes. We can book a demo of HAMMER CITY or CADabra on demo data, and show examples from past surveys without identifying client data.

What formats do you deliver in?

GIS layers loaded into the client's ArcGIS Online or another system, plus DWG, Excel and PDF files, dashboards and apps as needed. Every project is documented with its data source and date.

ST-04 Your next project

What do you want to move forward in your organisation?

Tell us what needs solving and we will come back with a proposed approach: a survey, a system, software, or a combination.