Accessibility settings

Settings are saved in this browser and apply on every page of the site.

Text size 100%

Accessibility is built into the site code. This menu is an extra, not a substitute.

ST-00 Surveys Two local authorities

Drainage surveys: inlets, manholes and lines on the map

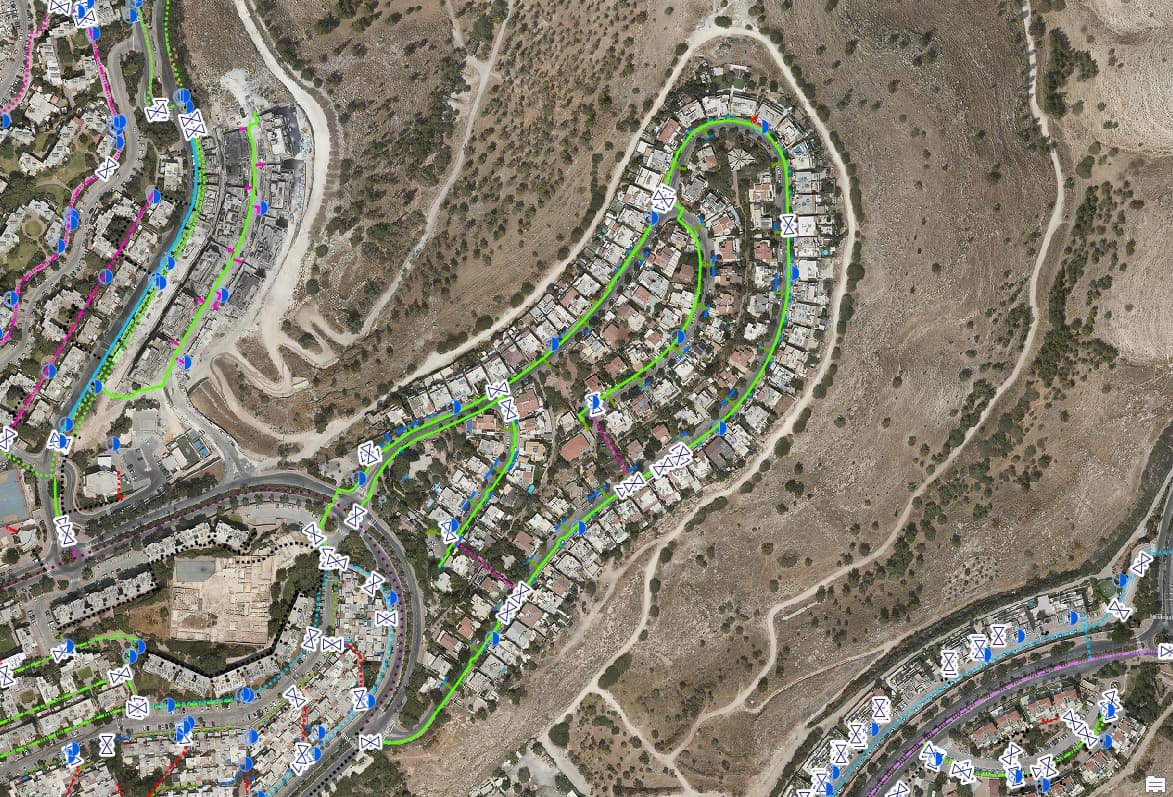
Urban drainage infrastructure mapped on the aerial photo for two authorities: inlets, manholes, drainage lines and inlet lines, with a city-wide survey map and a dashboard.

Source
Aerial photo
CRS
EPSG:2039 · E 226,358 · N 654,464

ST-01 The traverse

Challenge, solution, outcome

  1. ST-01

    The challenge

    Drainage information is often split between old drawings and the memory of operations staff. To plan cleaning before winter or deal with local flooding, you need to know where every inlet and manhole is and how they connect to the network.

  2. ST-02

    The solution

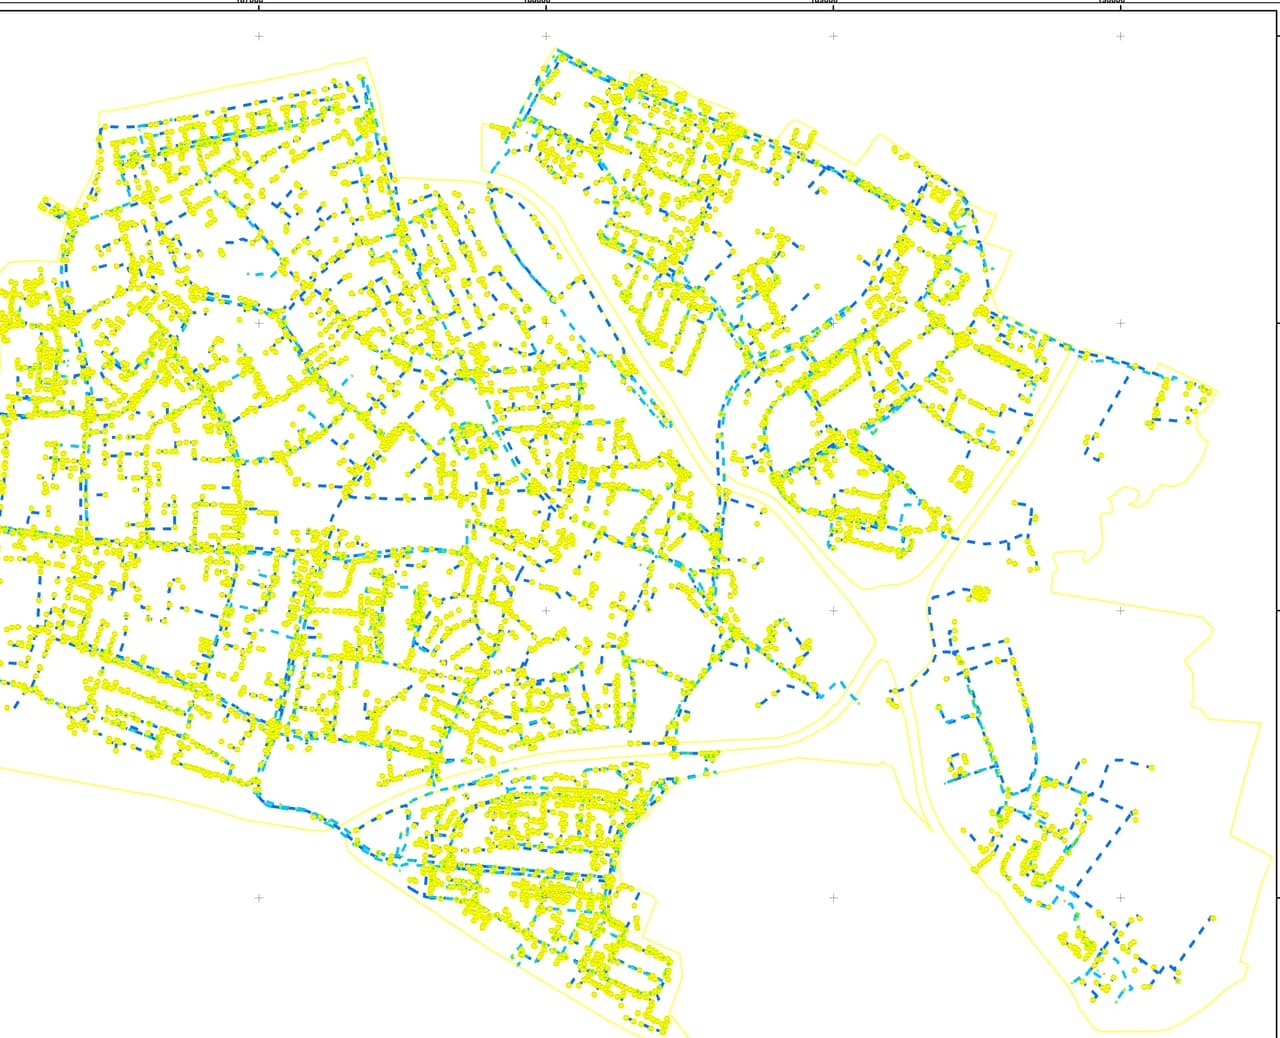
    We mapped the drainage elements on the aerial photo and built separate GIS layers for inlets, drainage manholes, drainage lines and the inlet lines that connect them to the network. One authority received a drainage-survey dashboard that brings the data together; the other received a city-wide survey map with a legend.

  3. ST-03

    The outcome

    Engineering and operations teams see the drainage network on the map, locate any inlet or manhole by position and plan maintenance from the layers instead of searching through drawings.
ST-02 What was delivered

Project deliverables

  1. Inlet and drainage-manhole layers
  2. Drainage-line and inlet-line layers
  3. Drainage-survey dashboard
  4. City-wide survey map with legend
Client
Two local authorities
Source
Aerial photo

ST-05 Your next project

What do you want to move forward in your organisation?

Tell us what needs solving and we will come back with a proposed approach: a survey, a system, software, or a combination.