ST-01 The traverse
Challenge, solution, outcome
-
ST-01
The challenge
On a hot afternoon, the difference between a shaded street and an exposed one is felt with every step. To decide where to plant trees or add shade, planners need to see heat at the level of a pavement, a path or a bus stop, and a general city heat map does not answer that question.
-
ST-02
The solution
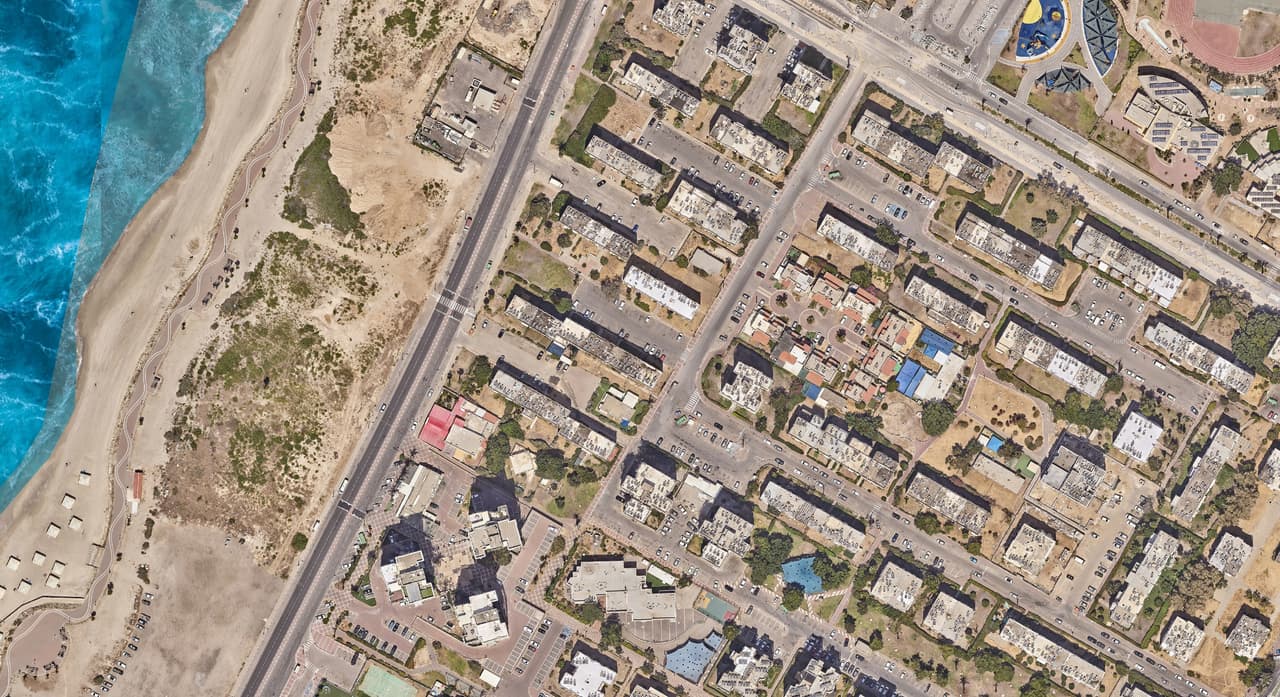
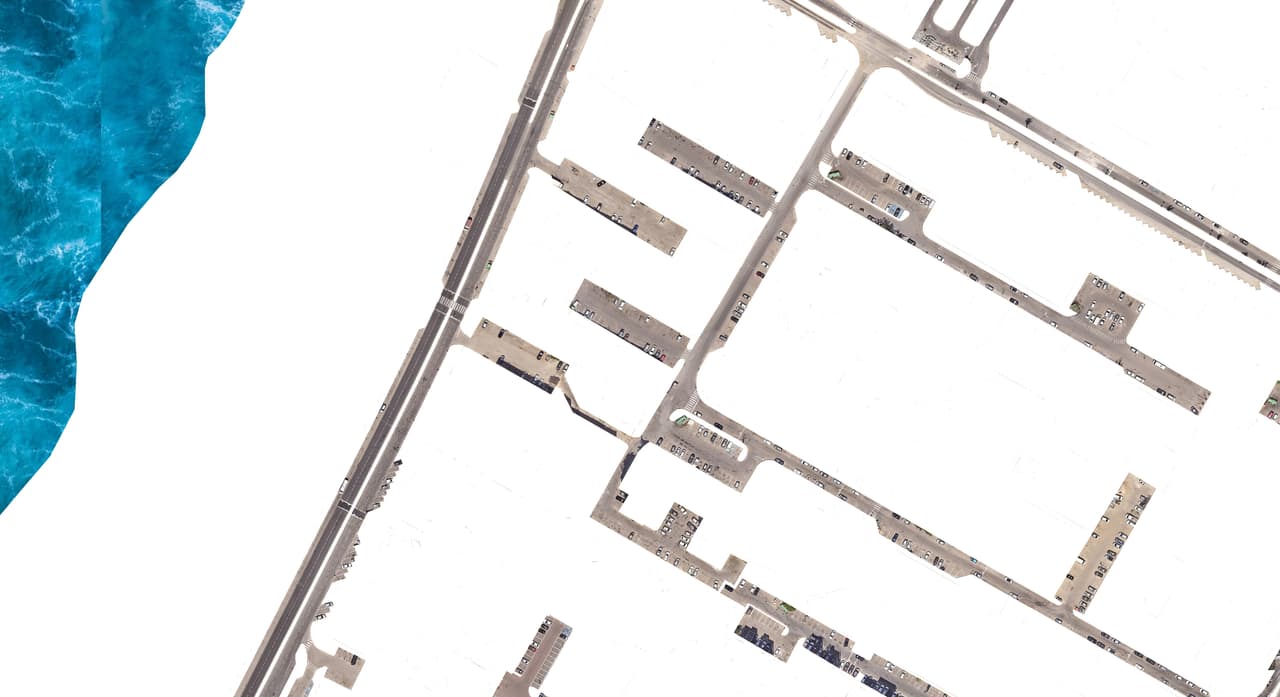
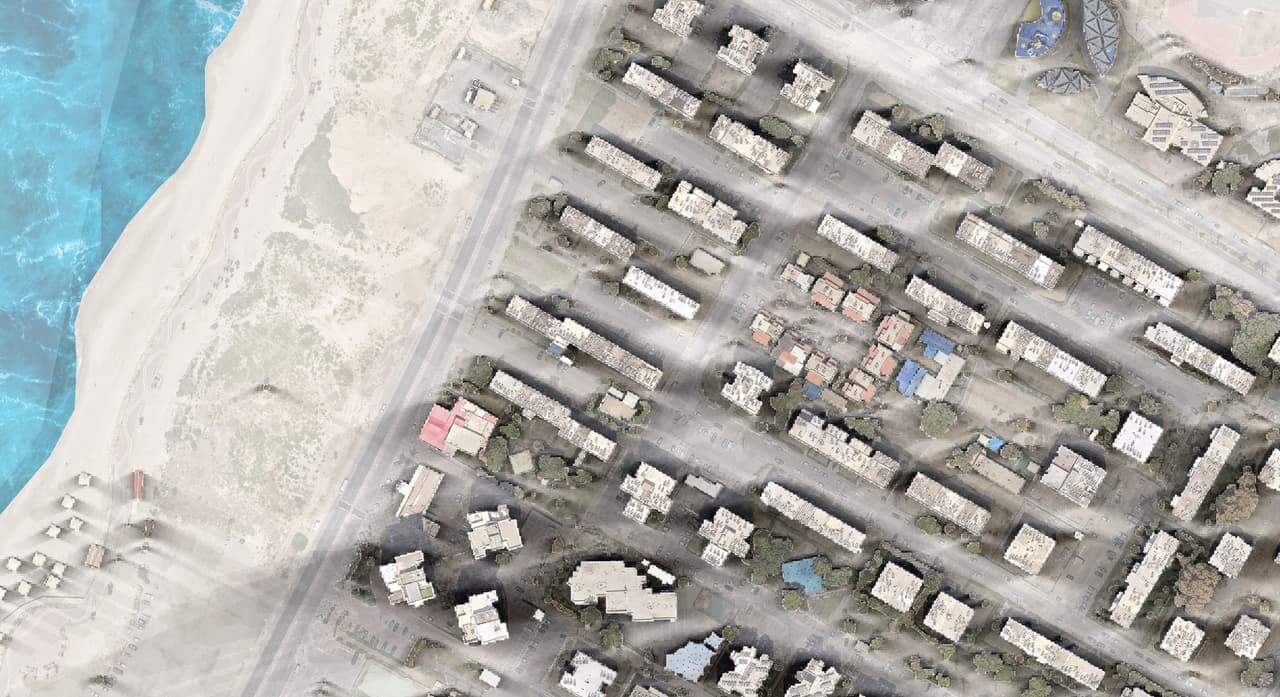
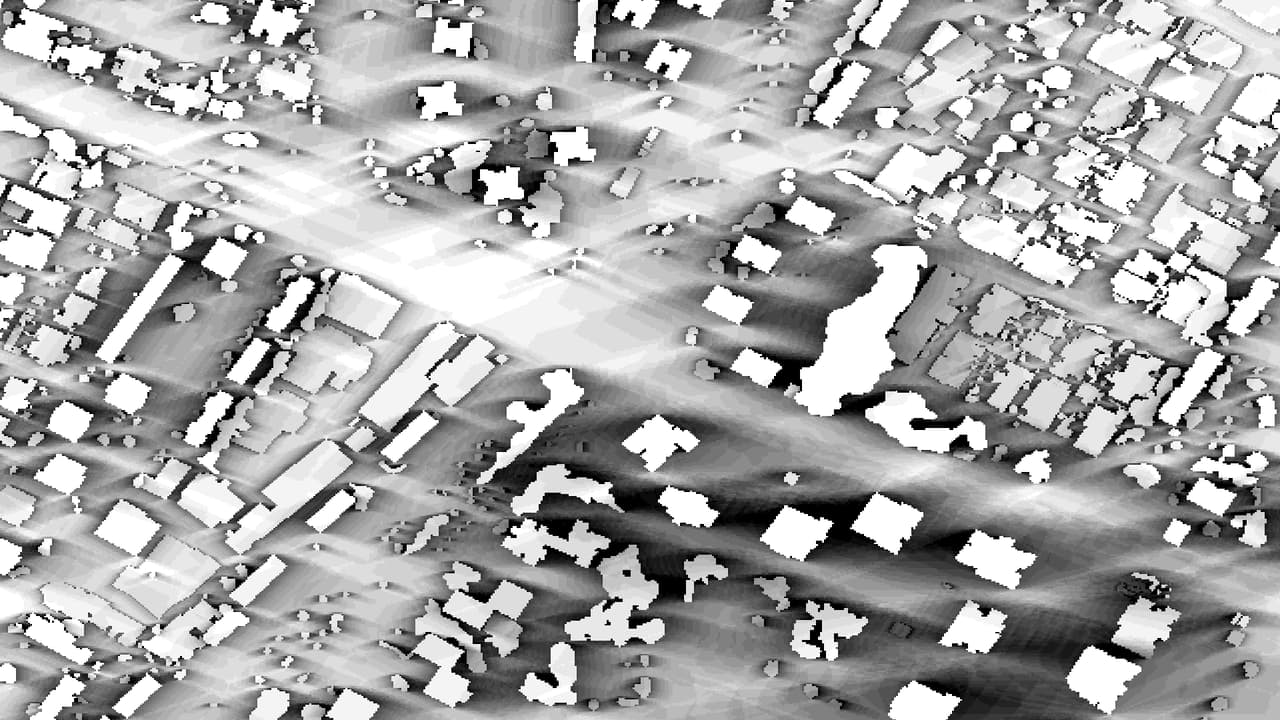
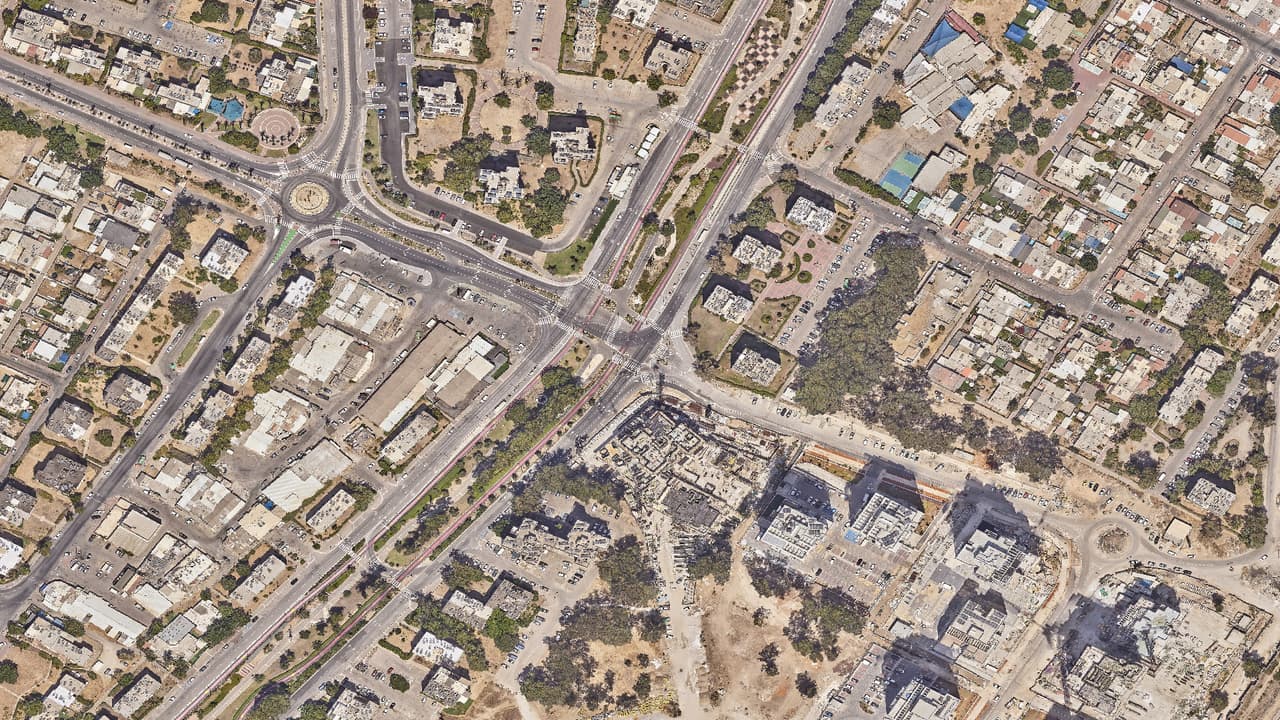
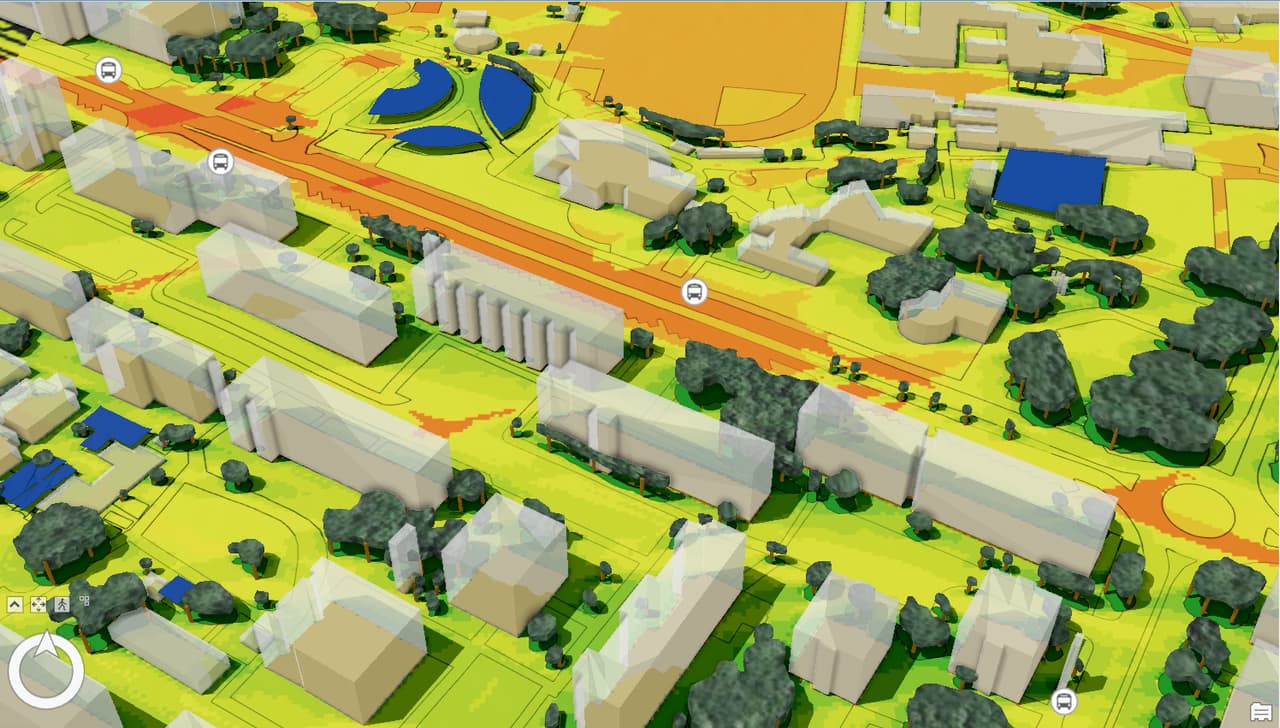
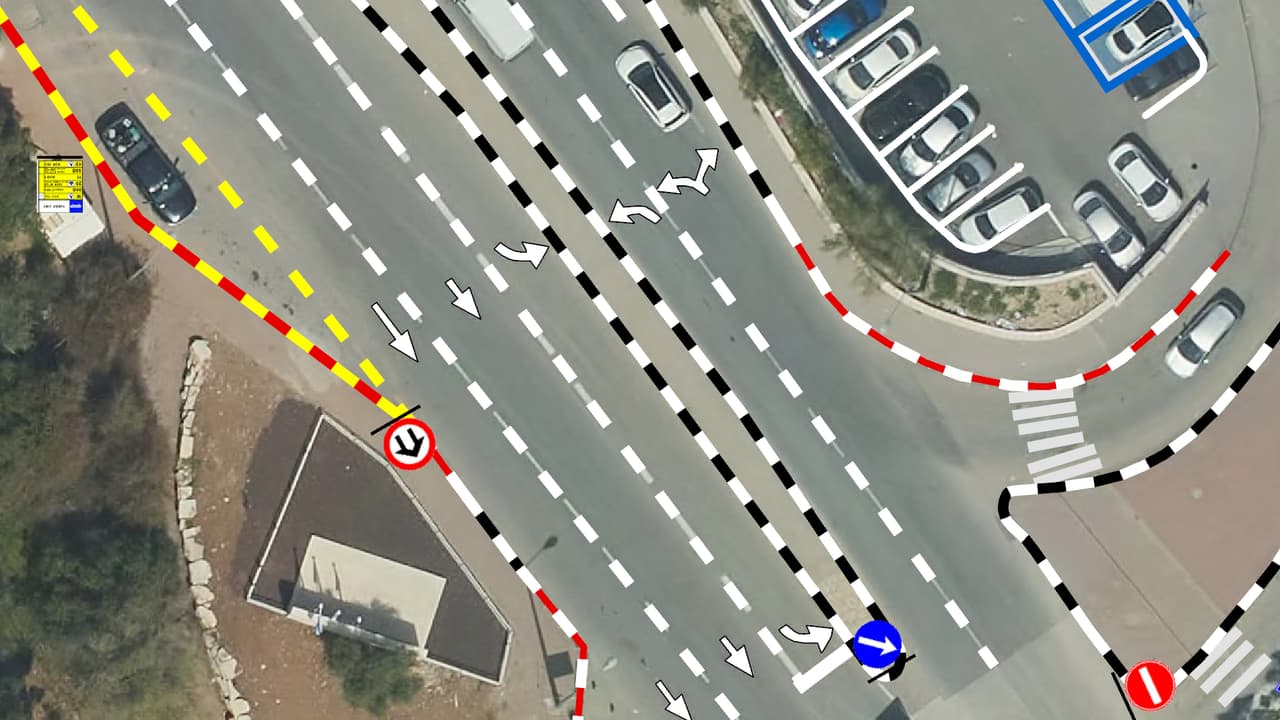
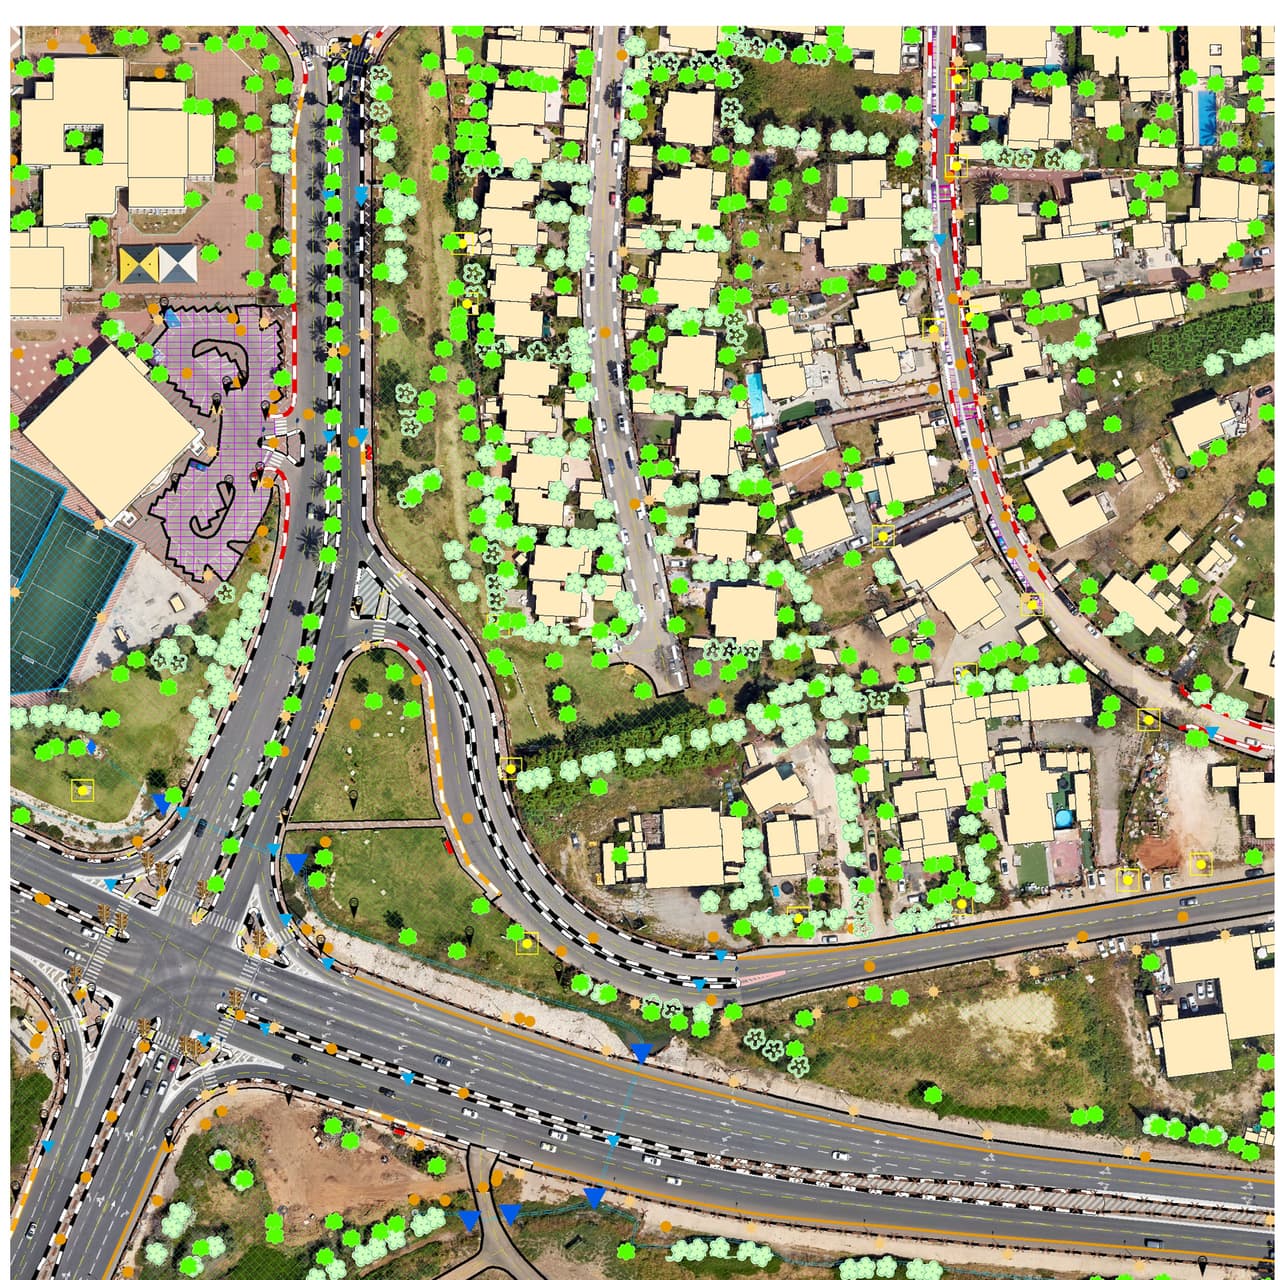
From the aerial photo we coded everything that drives heat in a street: tree canopies and their heights, shade structures and umbrellas with heights, vegetation, asphalt, pavements and paths, artificial surfaces, hedges, green areas, buildings with heights, and open ground. Using the heights, we cast shade every half hour across the day. A model that combines radiation, sun exposure, shade and the thermal response of each material produced an urban heat-island priority map.
-
ST-03
The outcome
The city now has a map that shows which streets, paths and bus stops run hottest and why, so tree planting and shade can be prioritised in shade-oriented planning. The layers were delivered as GIS and DWG, so planners who work in CAD can use them too.